-
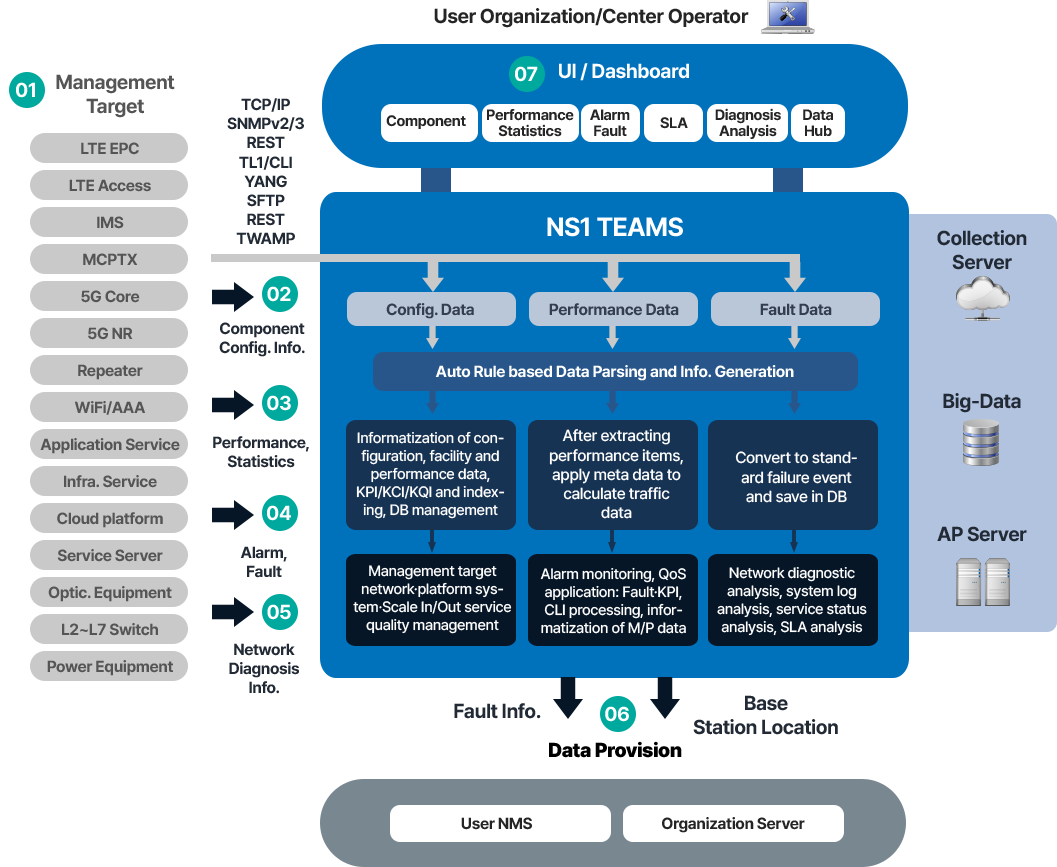
01
Management
target
Collecting fault
/Performance/
Stats/Component/
Infra data from EMS
(Core network, Base station, Power Equipment, Application service system, Data backbone system, etc.)
-
02
Component Info
Mapping the shape of managed devices through rule-based parsing and informatization of log data collected from linked devices → Manager automation
-
03
Performance Stats
After automating management targets through configuration management, automatic collection of performance, statistics, and alarms and threshold-based fault processing - Apply statistical formula → Create metadata → Hourly/daily/monthly statistics - Apply QoS Alarm → Issue Trouble Ticket → Vigilance - Application service server resources, HW Fault, Process monitoring
-
04
Fault Info
Collected failure info is converted into standard failure event format after extracting necessary items, stored in DB, and displayed on real-time monitoring UI.
-
05
Network diagnostic
information
RFC 5357 TWAMP standard-based IP Network quality diagnosis - Packet Loss, Latency, Link Fluctuation - Bufferbloat, Queue Size, QoS, Packet Analysis
-
06
Data Provision
Sharing management information, service development information, and integrated DB information - Comprehensive management and real-time provision of key information
-
07
UI/Dashboard
Provides real-time failure monitoring, performance monitoring, statistics UI, configuration UI, facility management, user management, server resource info., monitoring UI, and dashboard


